
Using a chart to rollup values from a sub entity
- Nov 5, 2018
- 3 min read
Updated: Apr 24, 2019

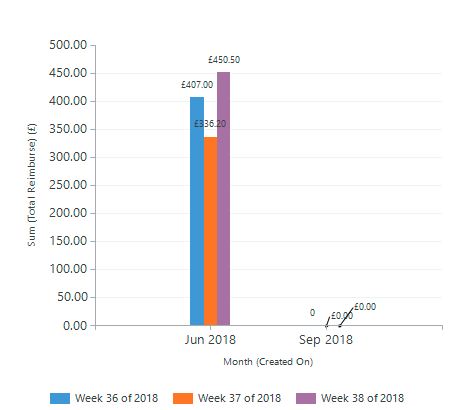


I had a requirement to show the split of expenses associated with a submission e.g. a one to many. Now in Dynamics if you want to include data from both you would have to create a view / chart at the lower level and include fields from the parent (submission). If you want to group items, then you will need a chart, but a chart at the child item level would not group by both the category of expense (child item) and the submission item.
Solution create a chart at the parent level, however, this can't be done through the normal chart editor you will need to edit the XML of the chart. I find the best way is to create it first as a personal chart, then export and import it into the solution (a special option just for charts). You can use this feature to also edit the XML.
Scenario
Parent Entity = Submissions (Weekly)
Child Entity = Expense item (Value, Category)
Create a chart
Create a chart on the parent entity of the type (column in this case) you want with the grouping you want but with a value field from the parent, we will replace this latter.
Build the XML
Create an advanced find view against the child entity. Include the fields from the child entity you want (Value and Category) + a field from the parent (doesn't matter which one). Download the fetchxml, this will give you the internal field names and a inverted structure.
Editing the XML
You will need to download the chart and edit the XML e.g. Notepad
We are going to edit the datadescription area. below if the highlighted changes, below that is the original chart XML so you can see how it's changed.
<datadescription> <datadefinition> <fetchcollection> <fetch mapping="logical" aggregate="true"> <entity name="bsmt_week"> <link-entity name="bsmt_expense" from="bsmt_week" to="bsmt_weekid" link-type="outer"> <attribute name="bsmt_totalchargeableamount" aggregate="sum" alias="_CRMAutoGen_aggregate_column_Num_0" /> <attribute name="bsmt_category" groupby="true" alias="_CRMAutoGen_groupby_column_Num_0" />
</link-entity> <attribute name="bsmt_weekdate" groupby="true" alias="_CRMAutoGen_groupby_column_Num_13" dategrouping="week" /> </entity> </fetch> </fetchcollection> <categorycollection> <category alias="_CRMAutoGen_groupby_column_Num_0"> <measurecollection> <measure alias="_CRMAutoGen_aggregate_column_Num_0" /> </measurecollection> </category> </categorycollection> </datadefinition> </datadescription>
Parent Entity Name
Child Entity joining to the parent one on bsmt_week (child) to bsmt_weekid (parent)
Important I kept the original alias names but remapped them
Original
<datadescription> <datadefinition> <fetchcollection> <fetch mapping="logical" aggregate="true"> <entity name="bsmt_week"> <attribute name="createdon" groupby="true" alias="_CRMAutoGen_groupby_column_Num_0" dategrouping="month" /> <attribute name="bsmt_totalreimburse" aggregate="sum" alias="_CRMAutoGen_aggregate_column_Num_0" /> <attribute name="bsmt_weekdate" groupby="true" alias="_CRMAutoGen_groupby_column_Num_13" dategrouping="week" /> </entity> </fetch> </fetchcollection> <categorycollection> <category alias="_CRMAutoGen_groupby_column_Num_0"> <measurecollection> <measure alias="_CRMAutoGen_aggregate_column_Num_0" /> </measurecollection> </category> </categorycollection> </datadefinition> </datadescription>
Before After
Full XML File after edit
<visualization> <visualizationid>{636E94AC-ABCC-E811-A96B-002248072781}</visualizationid> <name>Rollup</name> <primaryentitytypecode>bsmt_week</primaryentitytypecode> <datadescription> <datadefinition> <fetchcollection> <fetch mapping="logical" aggregate="true"> <entity name="bsmt_week"> <link-entity name="bsmt_expense" from="bsmt_week" to="bsmt_weekid" link-type="outer"> <attribute name="bsmt_totalchargeableamount" aggregate="sum" alias="_CRMAutoGen_aggregate_column_Num_0" /> <attribute name="bsmt_category" groupby="true" alias="_CRMAutoGen_groupby_column_Num_0" />
</link-entity> <attribute name="bsmt_weekdate" groupby="true" alias="_CRMAutoGen_groupby_column_Num_13" dategrouping="week" /> </entity> </fetch> </fetchcollection> <categorycollection> <category alias="_CRMAutoGen_groupby_column_Num_0"> <measurecollection> <measure alias="_CRMAutoGen_aggregate_column_Num_0" /> </measurecollection> </category> </categorycollection> </datadefinition> </datadescription> <presentationdescription> <Chart Palette="None" PaletteCustomColors="91,151,213; 237,125,49; 160,116,166; 255,192,0; 68,114,196; 112,173,71; 37,94,145; 158,72,14; 117,55,125; 153,115,0; 38,68,120; 67,104,43; 124,175,221; 241,151,90; 186,144,192; 255,205,51; 105,142,208; 140,193,104; 50,125,194; 210,96,18; 150,83,159; 204,154,0; 51,90,161; 90,138,57;"> <Series> <Series ChartType="Column" IsValueShownAsLabel="True" Font="{0}, 9.5px" LabelForeColor="59, 59, 59" CustomProperties="PointWidth=0.75, MaxPixelPointWidth=40" /> </Series> <ChartAreas> <ChartArea BorderColor="White" BorderDashStyle="Solid"> <AxisY LabelAutoFitMinFontSize="8" TitleForeColor="59, 59, 59" TitleFont="{0}, 10.5px" LineColor="165, 172, 181" IntervalAutoMode="VariableCount"> <MajorGrid LineColor="239, 242, 246" /> <MajorTickMark LineColor="165, 172, 181" /> <LabelStyle Font="{0}, 10.5px" ForeColor="59, 59, 59" /> </AxisY> <AxisX LabelAutoFitMinFontSize="8" TitleForeColor="59, 59, 59" TitleFont="{0}, 10.5px" LineColor="165, 172, 181" IntervalAutoMode="VariableCount"> <MajorTickMark LineColor="165, 172, 181" /> <MajorGrid LineColor="Transparent" /> <LabelStyle Font="{0}, 10.5px" ForeColor="59, 59, 59" /> </AxisX> </ChartArea> </ChartAreas> <Titles> <Title Alignment="TopLeft" DockingOffset="-3" Font="{0}, 13px" ForeColor="59, 59, 59" /> </Titles> </Chart> </presentationdescription> <isdefault>false</isdefault> </visualization>


Comments